
Web Pentesting using Browser’s Developer Console
Burp Suite or other similar proxy tool such as OWASP Zap and Caido are helpful in performing web application pentest. However, there will be a situation where you need to perform the testing in a strict environment due to the client’s security policy.
We had a few projects especially from financial institutions which required us to do the testing against their internal web application in a “jailed” environment with no internet access. Such as the web application can only be accessed via their remote access service such as “Citrix” or when they required us to only use their provided laptop which has no privileges to install anything within it with the command prompt disabled.
In this article, we would like to share our experience performing a web application pentest of one of the projects where we were only able to use Firefox and Chrome browser (luckily they were updated). We utilised the Developer Console to assist us with the testing. It was not really a comprehensive testing, but the results were sufficient and our client was happy with it.
Disclaimer: The following are some examples that our team drafted for your information. There is no real target in this article, and they were randomly picked while our team writing it.
Introduction
Developer tools is a set of web developer tools built directly into the browsers. The tool can be opened using the following approaches after you opened the browser:
- By pressing
F12key on your keyboard - By pressing
Ctrl + Shift + Ikeys on your keyboard in Windows - By pressing
CMD + Option + Ikeys on your keyboard in Mac - Right click on any area of the browser and choose
Inspectin Chrome/Firefox browser - By clicking on the hamburger menu (the three dots on top right of your browser) and then navigating to “More Tools” > “Developer Tools” in Chrome or “More tools” > “Web Developer Tools” in Firefox
Test cases
Other than using the Developer Tools to track web application’s requests through the “Network” tab and “Inspector”, there are other useful features that are generally untouched. Let’s list down test cases that generally we conducted in web application pentest and how they could be tested using the Developer Tools.
Edit and replay
Editing a request and replaying it is essential in web application pentest. We could say that even when using Burp Suite, the most feature that we utilised is the Repeater.
In Firefox, we may use the “Resend” to replay the same request. You could as well edit the request before resend it using the “Edit and Resend”. These options can be found by right click on the request that we would like to test from the “Network” tab.

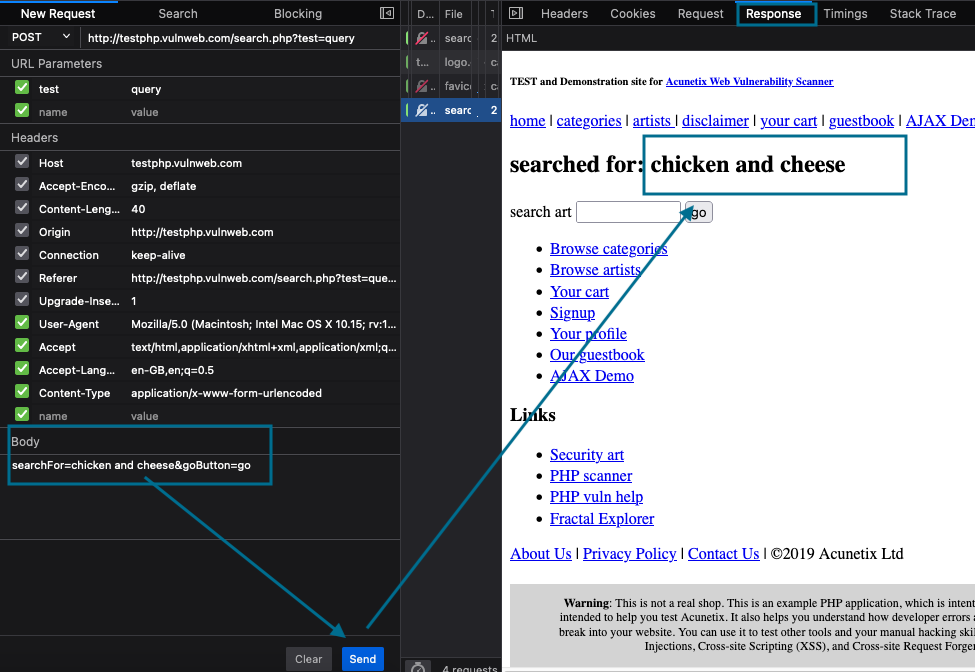
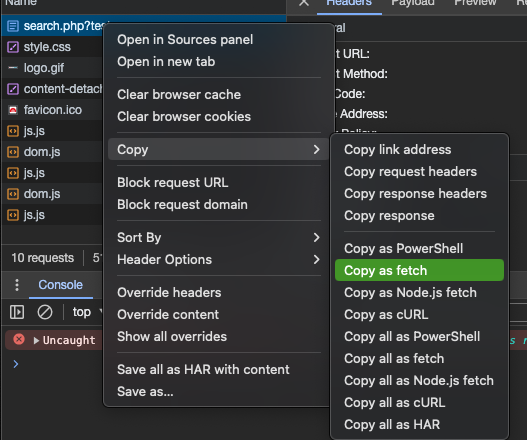
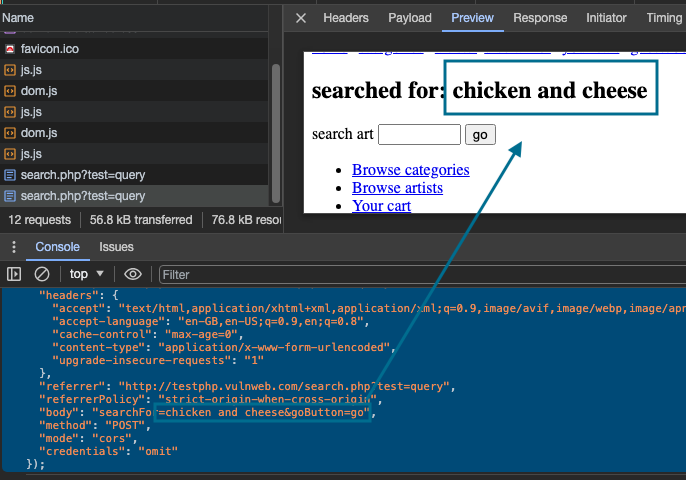
In Chrome, it is not straightforward as in Firefox. To replay and edit a request, we can use the “Copy as fetch” and paste it in the console to replay it.
“Copy as fetch” is available by right clicking on the request from the “Network” tab of the Developer Tools, then navigate to Copy > Copy as fetch.
Cookies
Web application cookies is one of the area where should be focused in a pentest. In a pentest report, the cookies configuration and manipulation are some test cases that most of our clients would like to see in the report.
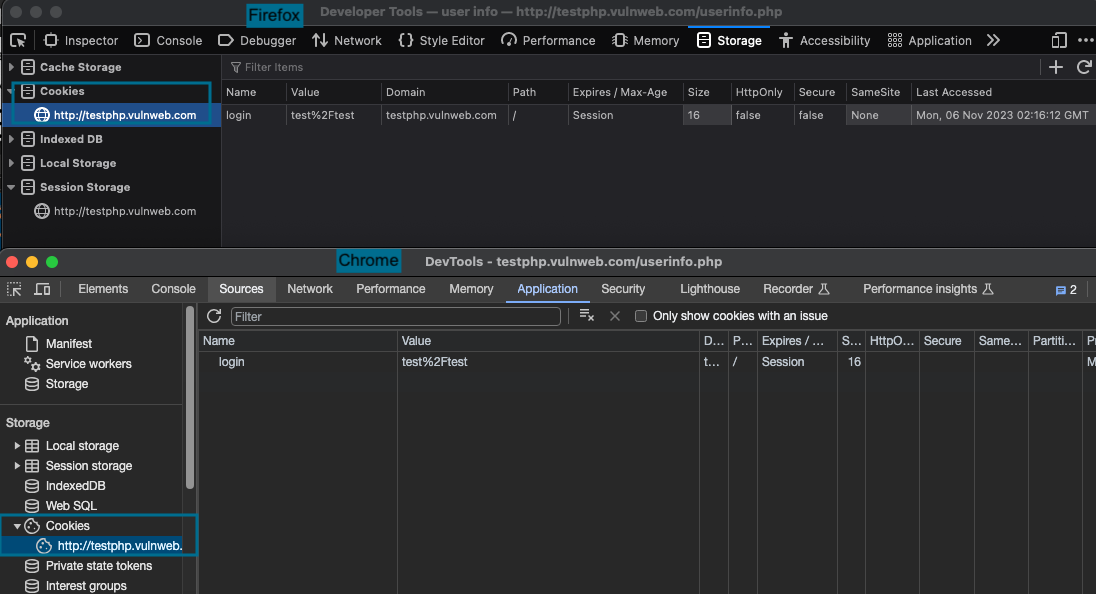
In Firefox, the cookies can be seen by navigating to Storage > Cookies. While in Chrome, it is located at Application > Storeage > Cookies
Using this feature, we could determine the cookies configuration such as if Secure , HttpOnly and SameSite have been enabled. We could as well try to manipulate the cookies’ values.
The cookies information could as well be viewed from the “Network” tab, by clickling on the request and view the right side of it which generally included with “Headers”, “Cookies”, “Request” and “Response”.
URLs and endpoints gathering
Gathering information from endpoints and URLs available within the web application is important to allow us to understand its workflow. In a proxy tool such as OWASP ZAP or Burp Suite, their spidering feature is really handy for this purpose.
We could still do the same by using the Developer Tools, but it is not as easy as by using the proxy tool. There are few approaches that we used for this purpose, and of course they are all require manual interaction:
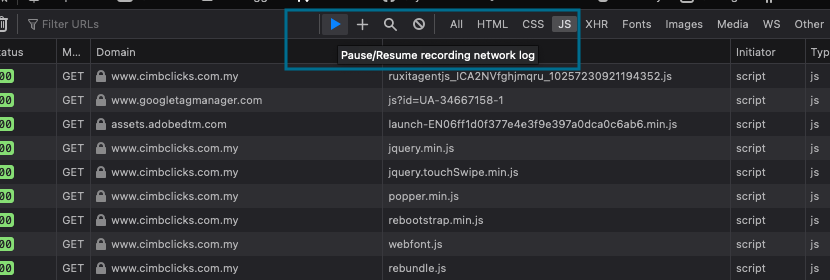
Using the “Network” tab
- Browse to the website while the Developer Tools is open
- Click on the pause button to ensure the requests will not be interrupted
- Filter the results based on type of files. Usually, JavaScript and document files are our best priority.
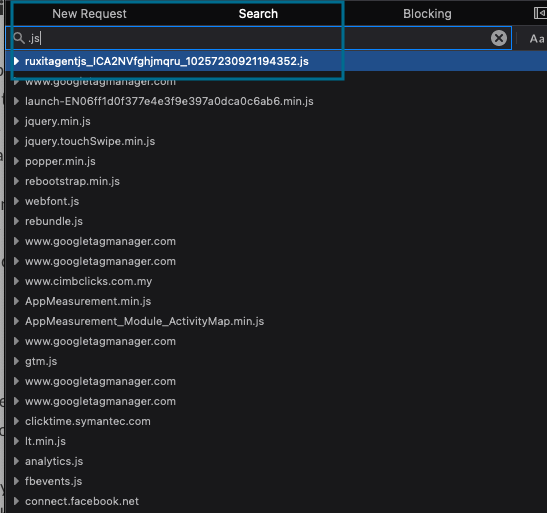
- In Firefox, you could use the “Search” function to filter the results
- Similarly can be done on Chrome
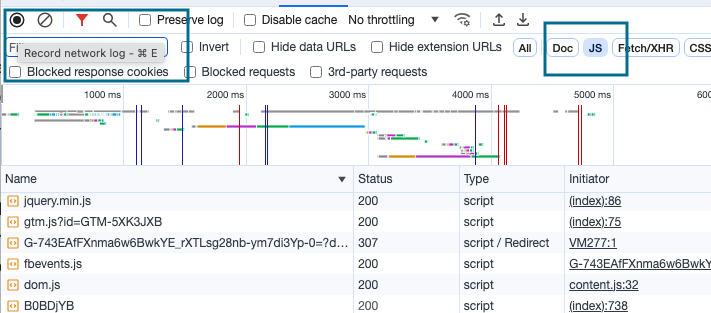
Using the “Memory” tab (Chrome)
- Sometimes, we were able to identify some interesting endpoints by investigating the Heap Snapshot taken from the “Memory” tab in Chrome

The Console
From our reading, “Console” would probably will be one of the powerful features in the Developer Tools. If you are good with JavaScript programming, this feature will be your favourite. Some examples that we generally use are as the following:
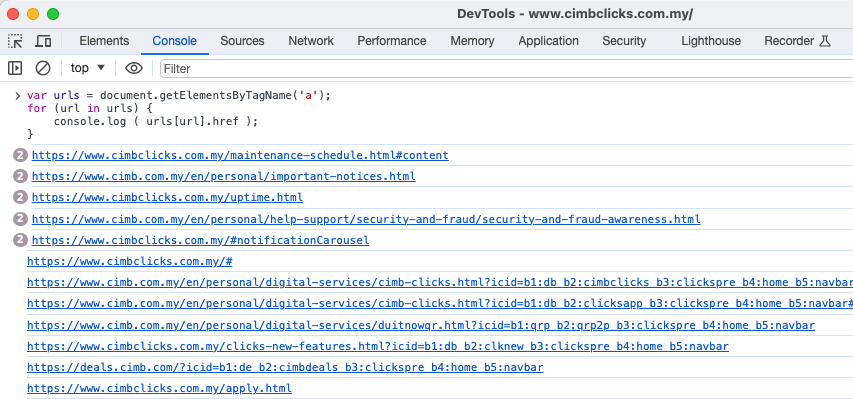
URL scraping
Using the following codes, paste it on the console (we tested this in Chrome)
var urls = document.getElementsByTagName('a');
for (url in urls) {
    console.log ( urls[url].href );
}
Encode/Decode
btoa("text-to-base64")
atob("base64-to-text")
encodeURIComponent("text-to-URLEncode")
decodeURIComponent("text-to-URLDecode")
escape("text-to-HTMLEncode")
unescape("text-to-HTMLdecode")

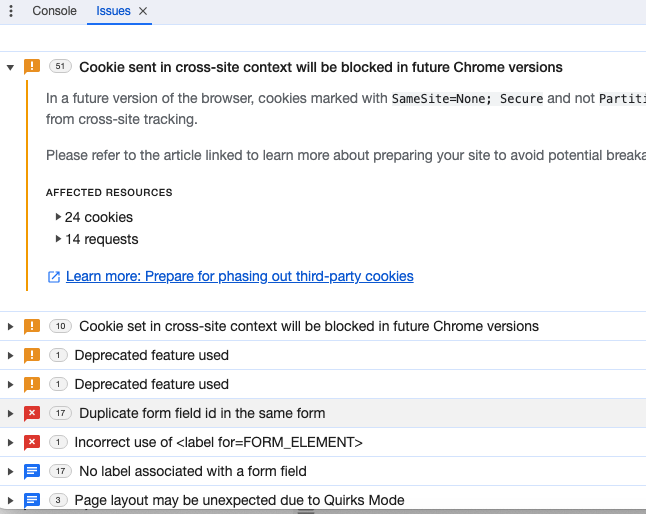
Monitoring errors and warnings
These information generally help us to understand the HTTP Headers’ misconfiguration
Notes
The above are approaches that generally we used to assist us in performing the web application pentest in a restricted environment. There are many features that we have not explore yet. Performing in a restricted environment generally limits what test cases can be carried out. A lot of time and effort are required as all of the testing need to be done without automation. Additionally, the client generally already aware of their security controls implemented within this restricted environment. Due to that, many times, the effort days scoped for this type of testing is short.
References:
- https://github.com/GoogleChrome/lighthouse/blob/HEAD/docs/user-flows.md
- https://www.bitdegree.org/learn/chrome-memory-tab#memory-panel-explained
- https://www.datablist.com/learn/scraping/extract-urls-from-webpage
- https://www.youtube.com/watch?v=msGZbEkdBjU
- https://www.youtube.com/watch?v=3W65ji1gc8c
- https://www.mattjennings.net/extracting-urls-web-page-chrome-developer-tools